Results Map
What the Map Shows
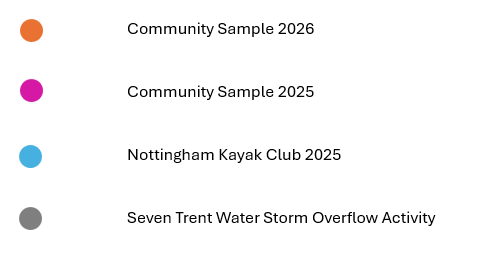
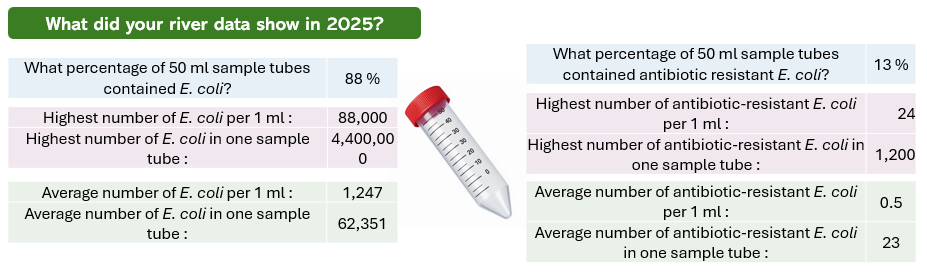
Thank you to everyone who took part in sampling for this round of the project! The map shows levels of E. coli bacteria found in your river water samples. E. coli is commonly found in the environment and is used as an indicator of faecal contamination – or in simple terms, it helps show if there may be “poo germs” in the water. This doesn’t necessarily mean pollution is from human sewage – E. coli can come from many sources, including livestock, birds like ducks and geese, and even pets. Importantly, although we found E. coli in many samples, most notably after periods of rainfall, only a very small number showed signs of resistance to antibiotics, which is reassuring.
This project is about building a picture over time of where people use rivers and what the water quality is like in those areas. While E. coli levels in rivers are not currently regulated (unlike drinking or designated bathing waters), if we see patterns where high bacteria levels overlap with places people access waterways recreationally, we’ll share findings to explore what can be done. We’re not here to point fingers – just to understand more and help inform positive action where appropriate.
Understanding Your River Sample Results
When water quality is monitored for bathing, levels of E. coli below 900 CFU per 100 ml are generally considered acceptable. Your results are shown per ml, so any results above the threshold of 9 E. coli CFU per ml would typically be classified as poor quality under UK bathing water standards. While most rivers are not designated bathing sites, this benchmark helps give a sense of how clean the water is. You can read more at the Environment Agency’s guide to understanding water quality data.
We’re also tracking antibiotic-resistant E. coli. So far these seem to be rare in your samples, which is good news. Antibiotic resistance is an important and growing problem, which can make bacterial infections more difficult to treat. You can help reduce the risk of antibiotic resistance by using antibiotics responsibly and never flushing them. Find out more about antibiotic resistance and how you can help here – How Can You Help?
Thank you for helping with our project. Together, we’re building a better understanding of our rivers whilst enjoying the wonderful blue spaces on our doorstep!
To help us measure the impacts of our project, please consider completing the survey below.
Results Summer 2025
Staying Safe Around Our Waterways
Bacteria like E. coli are naturally found in the environment and can come from many sources, including wildlife, farm animals, and sewage. While drinking and designated bathing waters are regulated, most rivers and lakes are not routinely monitored for E. coli.
Finding E. coli doesn’t necessarily mean pollution is from sewage – rainfall, birds and livestock can all contribute. This project aims to understand where people use the water and where bacteria levels are high.
We encourage everyone to enjoy our waterways safely. Sensible precautions include:
- Wash hands after water contact
- Don’t swallow river or lake water
- Cover cuts with waterproof plasters
- Avoid swimming in stagnant or discoloured water.
For more tips, see the Rivers Trust and Outdoor Swimming Society.